send link to app
datafizz.io app for iPhone and iPad
4.6 (
2496 ratings )
Reference
Education
Developer: PikCity, LLC
Free
Current version: 2.0.3, last update: 7 years agoFirst release : 09 Aug 2014
App size: 74.81 Mb
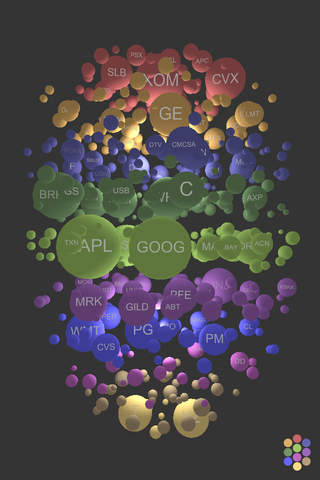
A colorful, whimsical display methodology for 3D data visualizations. Browse S&P 500 index market stats (data updated every 30 minutes), world and urban demographics, as well as US County Census data. Still in beta. Send bugs, comments and suggestions to [email protected]


